War, inflation, recession, oil prices and inverted yield curves
Posted By RichC on March 26, 2022
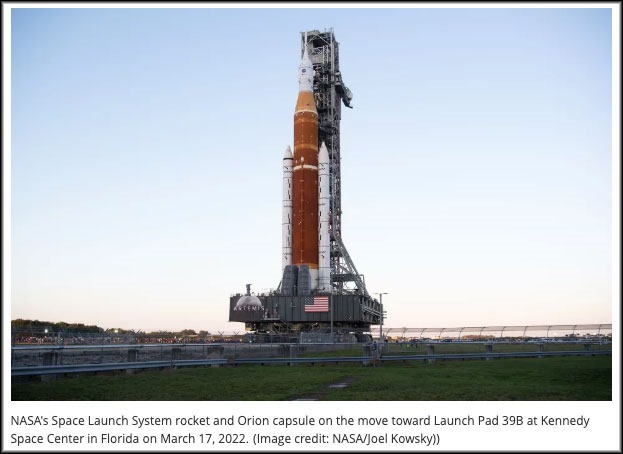
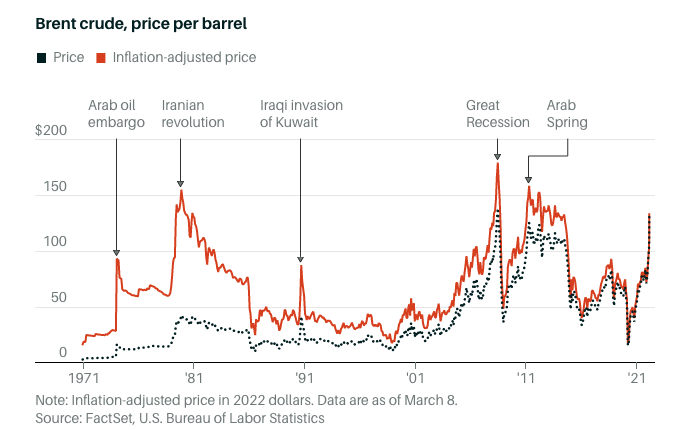
The “pain at the pump” is definitely real if you are buying fuel and if you have spend the last decade with gas and diesel at 40+% lower than we are seeing today. That said, in inflation-adjusted dollars, we are still off the highest per barrel prices that we have seen (chart below). Most oil traders expect the refined fuels at the pump to be even higher this summer before any additional capacity makes in “into the pipeline.”
Unfortunately that additional capacity, expected in 6 to 9 months, “could” come too late to prevent the next recession or the ability for most American to spend and keep the economy chugging along. If people stop buying, traveling, etc … people stop working and will have fewer dollars. If history teaches us anything, inflation is often brought into check by a recession or two. We can still hope that the Federal Reserve can manage a “soft landing” as they say and that perhaps the supply chain issues will ease some shortage pressure. BUT … now that Russia has invaded of Ukraine (major food supplier to Europe) we could see food shortages … and therefore higher prices … the next inflation kick.
Normally this is where I would add that the “lack of government discipline” (both DEMs and GOP) when it comes to borrowing and spending/wasting money, but I’ll refrain for now. Instead will point out an economic chart that points out Treasury yield curve inversions … a very accurate predictor of a recession, as mentioned before.
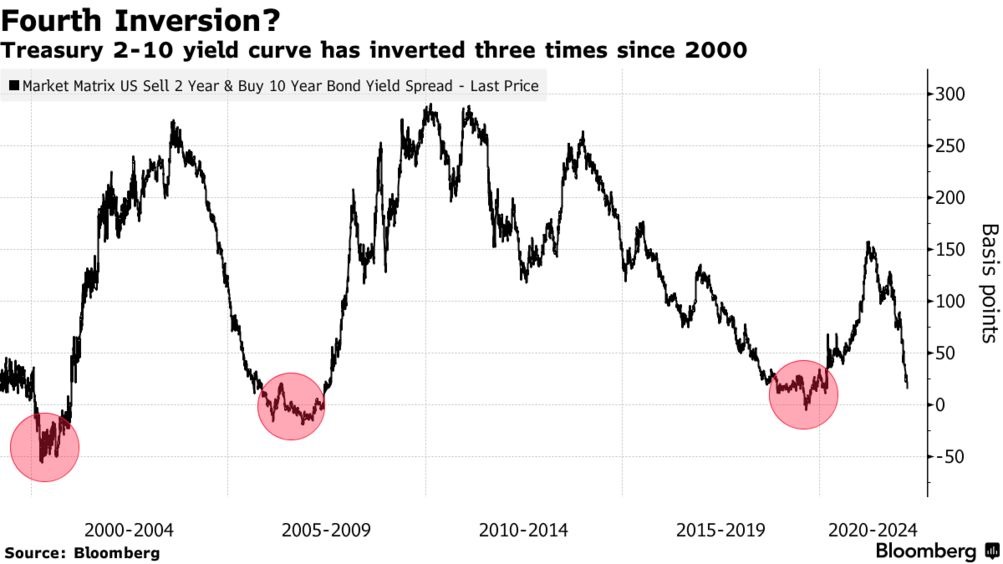
The Yield Curve Is Inverted! Remind Me Why I Care
If you’re wondering what a yield curve is and why there’s so much fretting in the U.S. over it flattening — and parts of it even inverting — you’re not alone. Late last year, Google searches for “yield curve inversion” shot up to their highest level ever. Here’s what the fuss is about.
1. What’s a yield curve?